An easy-to-use, interactive and dynamic online tabulation experience, intuitive statistical analyzer and various report generators.
Quicktabs is a cloud based survey, flat table analyzer. It is easy to use and empowers the users with significance testing and analytics without them needing to know anything about research nor statistics.
The tool is designed to read the data, provide various ways of exploring the data and reaching valuable insights and export the findings into Excel, PowerPoint and Images to include in presentations or research papers.
Features
Survey Database & Privileges. Store unlimited number of surveys or datasets.
Tabulations, Options & Management
Map View & Meta Data
Import/Export various formats: CSV, ASC, DAT, TXT, XLS, XLSX, Triple-S
Export to Excel, PowerPoint & Images
Competence
Single Wave (One Survey) & Tracking (Two or more Surveys)
Satistical Significance Testing (Quantum's various T-Tests)
Inituitive Descriptive and Significance Statistical Tests
Designed for students doing research, market researchers, or anyone interested in analyzing surveys
Benefits
User Friendly
Explore Blazingly Fast
Practical to include insights in Presentations
Complete reports in less than tenth of the time when working it out manually in Excel
Understand data fully from various points of views
MODULES
MODULES
These are the modules that QuickTabs provides. Click on the module name to expand details.
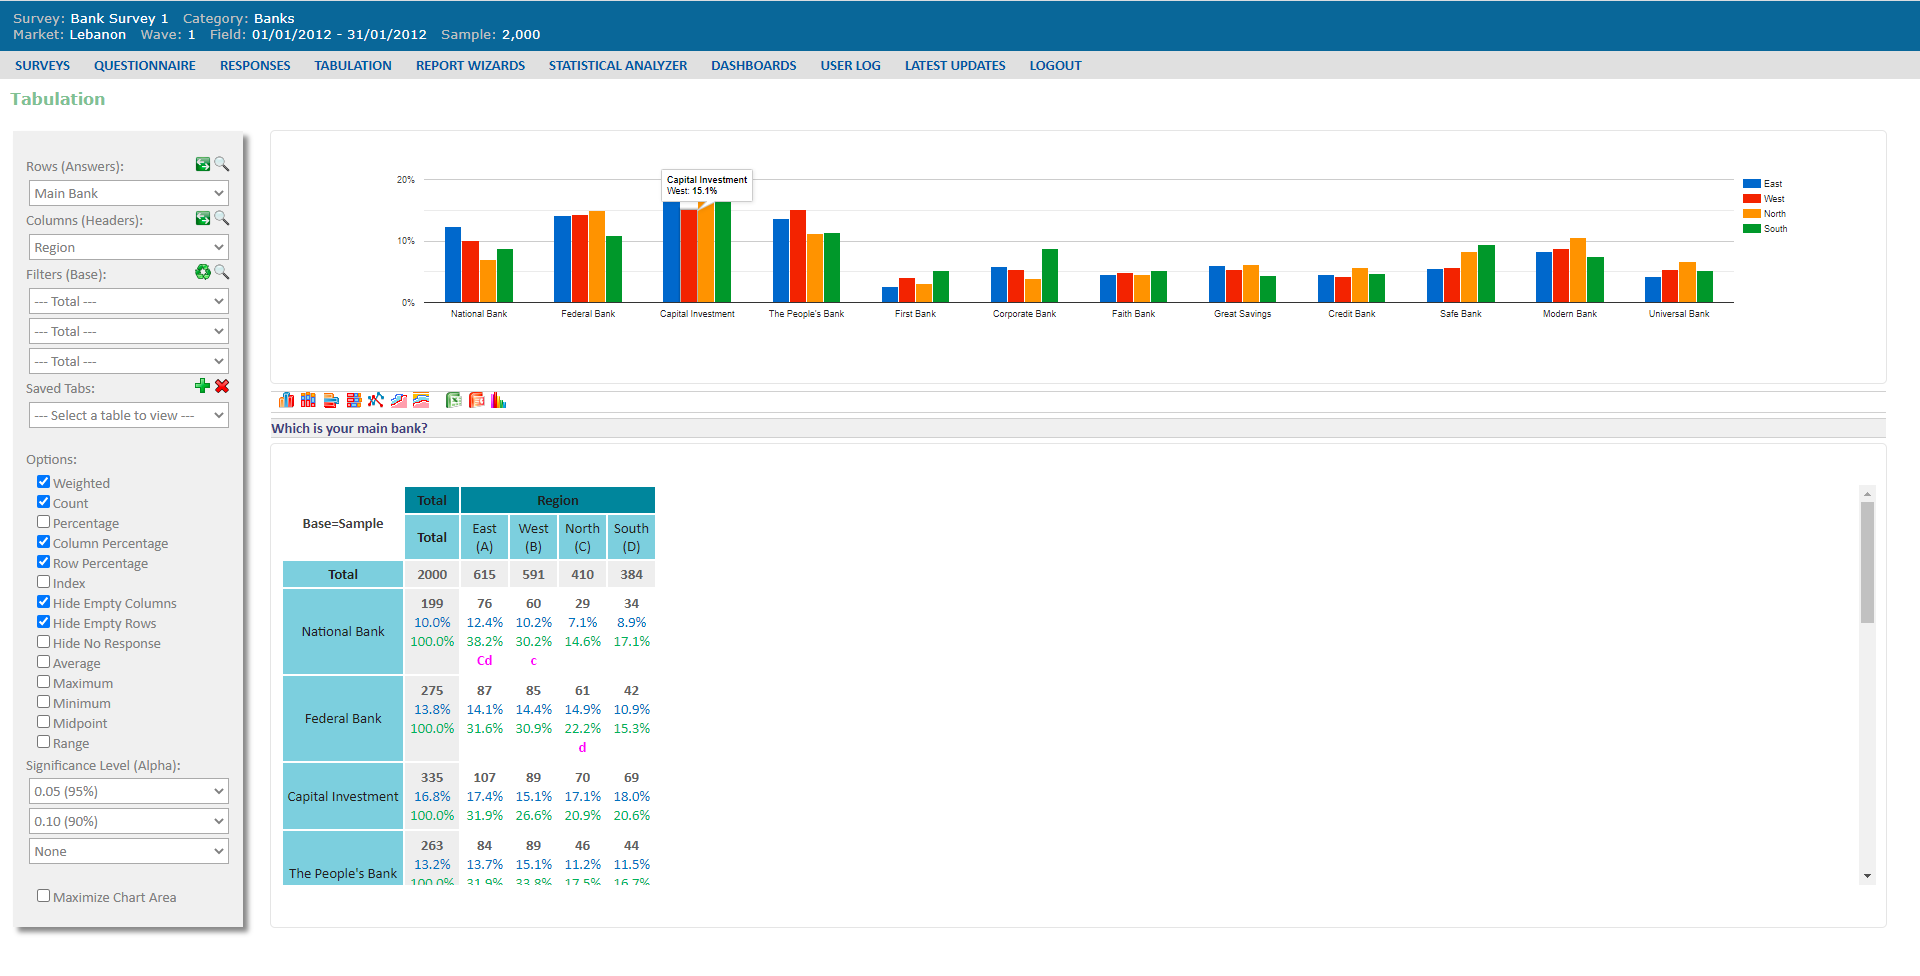
Cross-tab any two Variables.
A set of options to view percentages (column, row), averages, maximums, minimums, midpoints, ranges
View up to 3 level significance tests simultaneously within the cross-tabs (Ex. 99%, 95%, 90%)
Apply Filters
Load/Save Tabs
Chart Types Options
Export to Excel, PowerPoint, Image
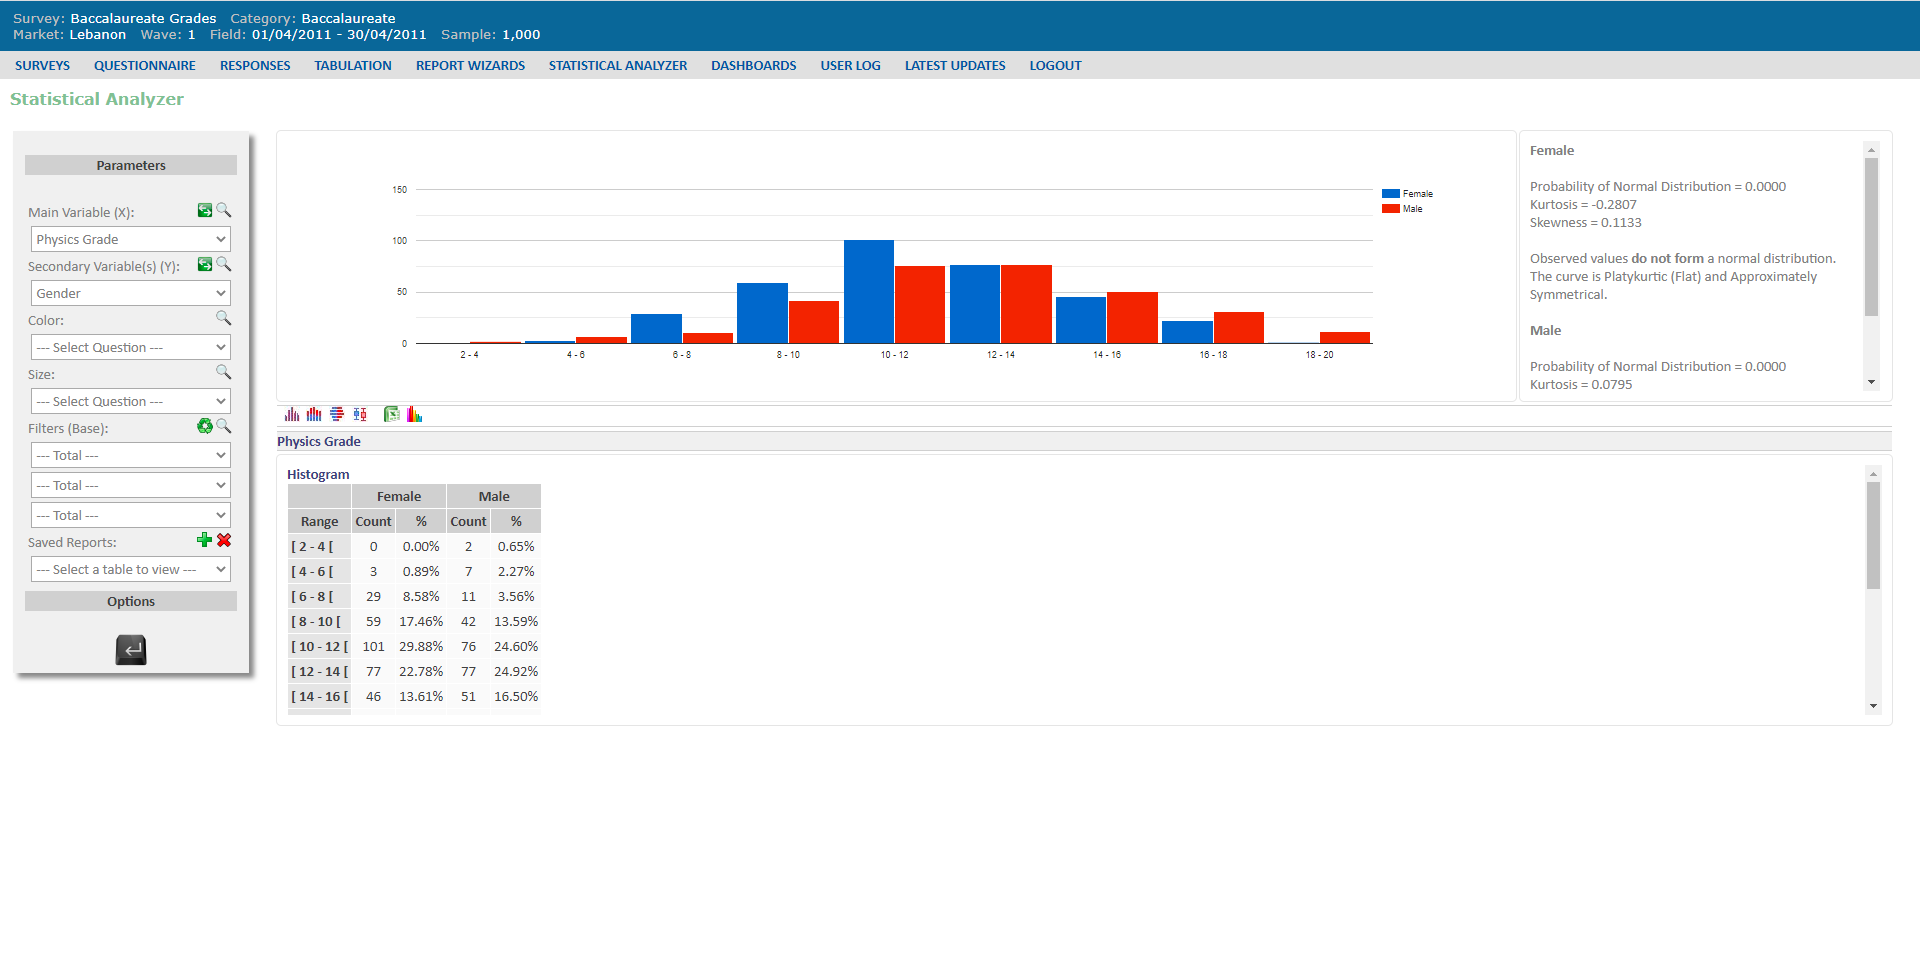
Automated tests for significant differences between any kinds of Variables:
T-Test, F-Test, U-Test, K-Test
Pearson, Spearman, Kendall Correlation Tests
Normality, Chi-Squared
Curve Description:
Kurtosis
Skewness
Probability of Normal Distribution
Range
Actual Population in Range
Expected Population in Range
Expected Frequence outside Range
Descriptive Statistics
Provides different Levels of Confidence
Ability to specify X/Y Axes, Color and Size
Captions summarize results in plain English
Status Report
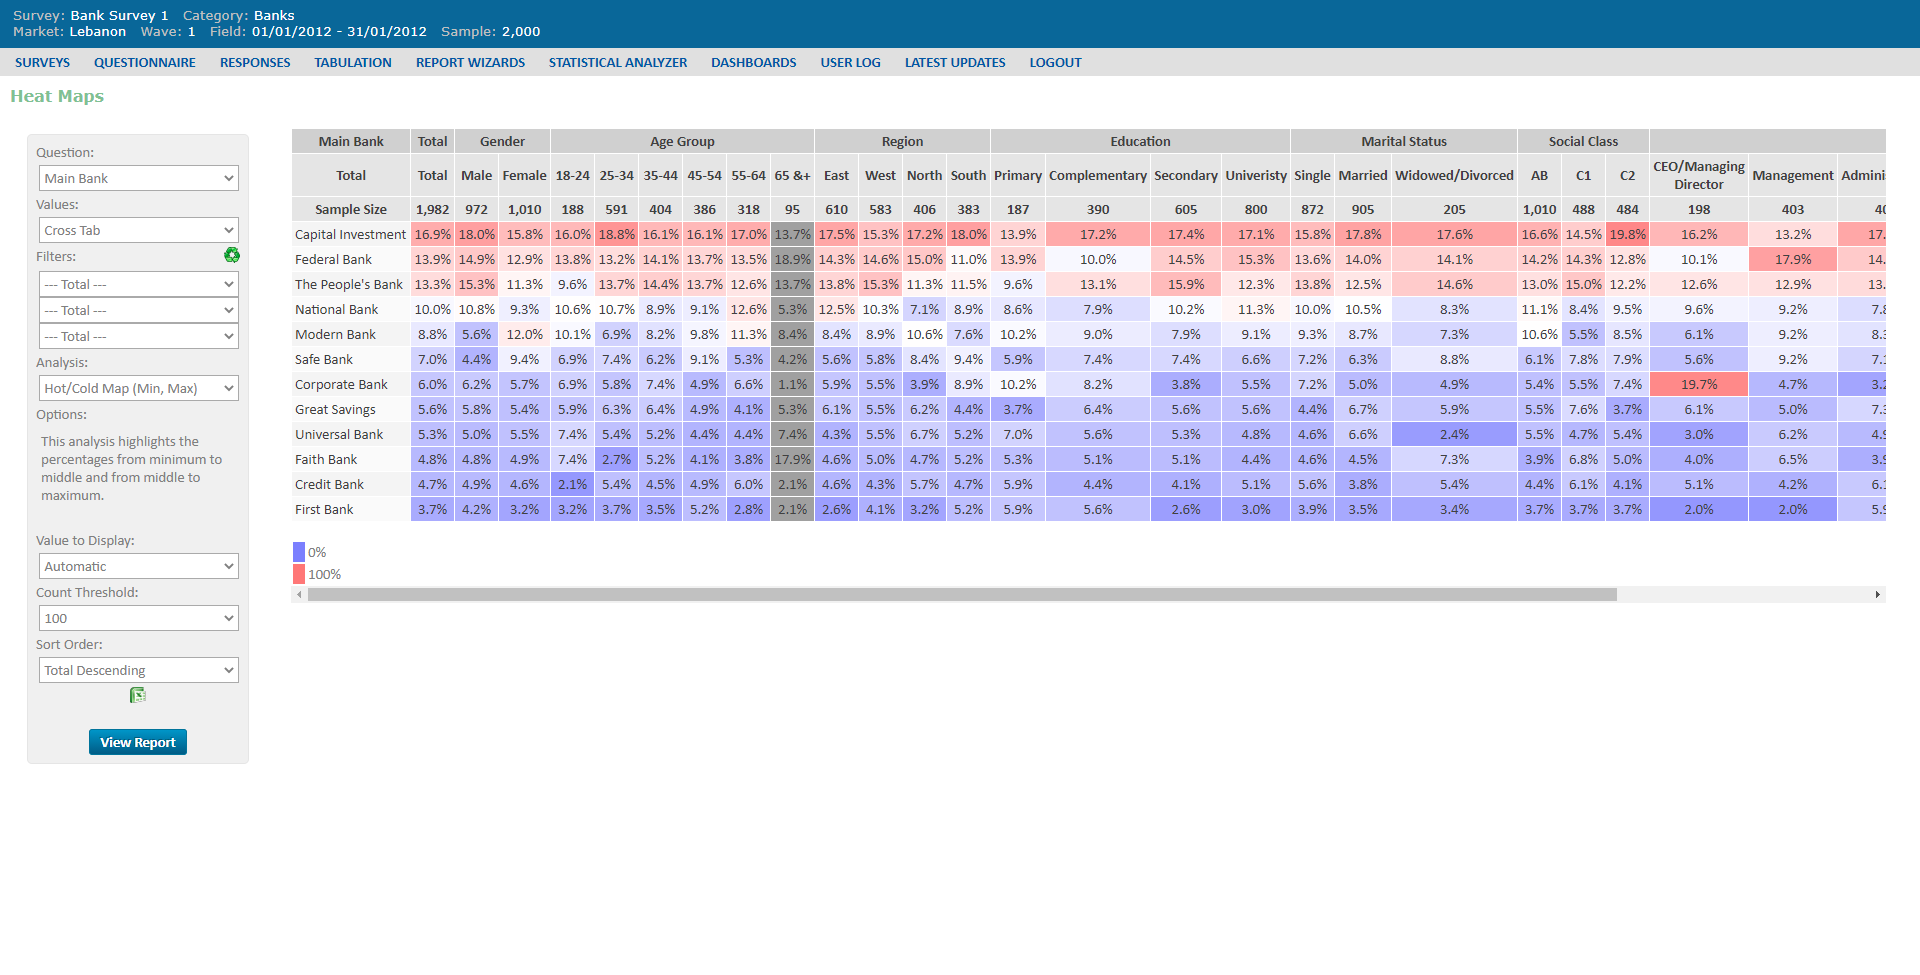
Heat Maps
Custom Tables
Batch Charts
Differentiation Report
Most/Least Performing
Correlation Table
Information Gain
Pareto Charts
Most/Least Differentiating Groups
Time-Segment Reports
Program Ratings
Share Of Viewing (SOV)
Top Programs
Advanced Demographic Filters
Validations
TouchPoint Optimizer
Customer Satisfaction
Employee Evaluation
Purchasing Journey
Create unlimited number of dashboards based on Report Wizards, Charts, Tables
Customer LifeCycle
Various Paths
Feedback Evolution
Animated Ratings
User Feedback:
Functionality
90%
Graphic Design
80%
User Friendliness
100%
Analyses & Insights
100%
Support
100%
50+
Analytics
20+
Statistical Tests
20+
Interactive Reports
5+
Data Source Types
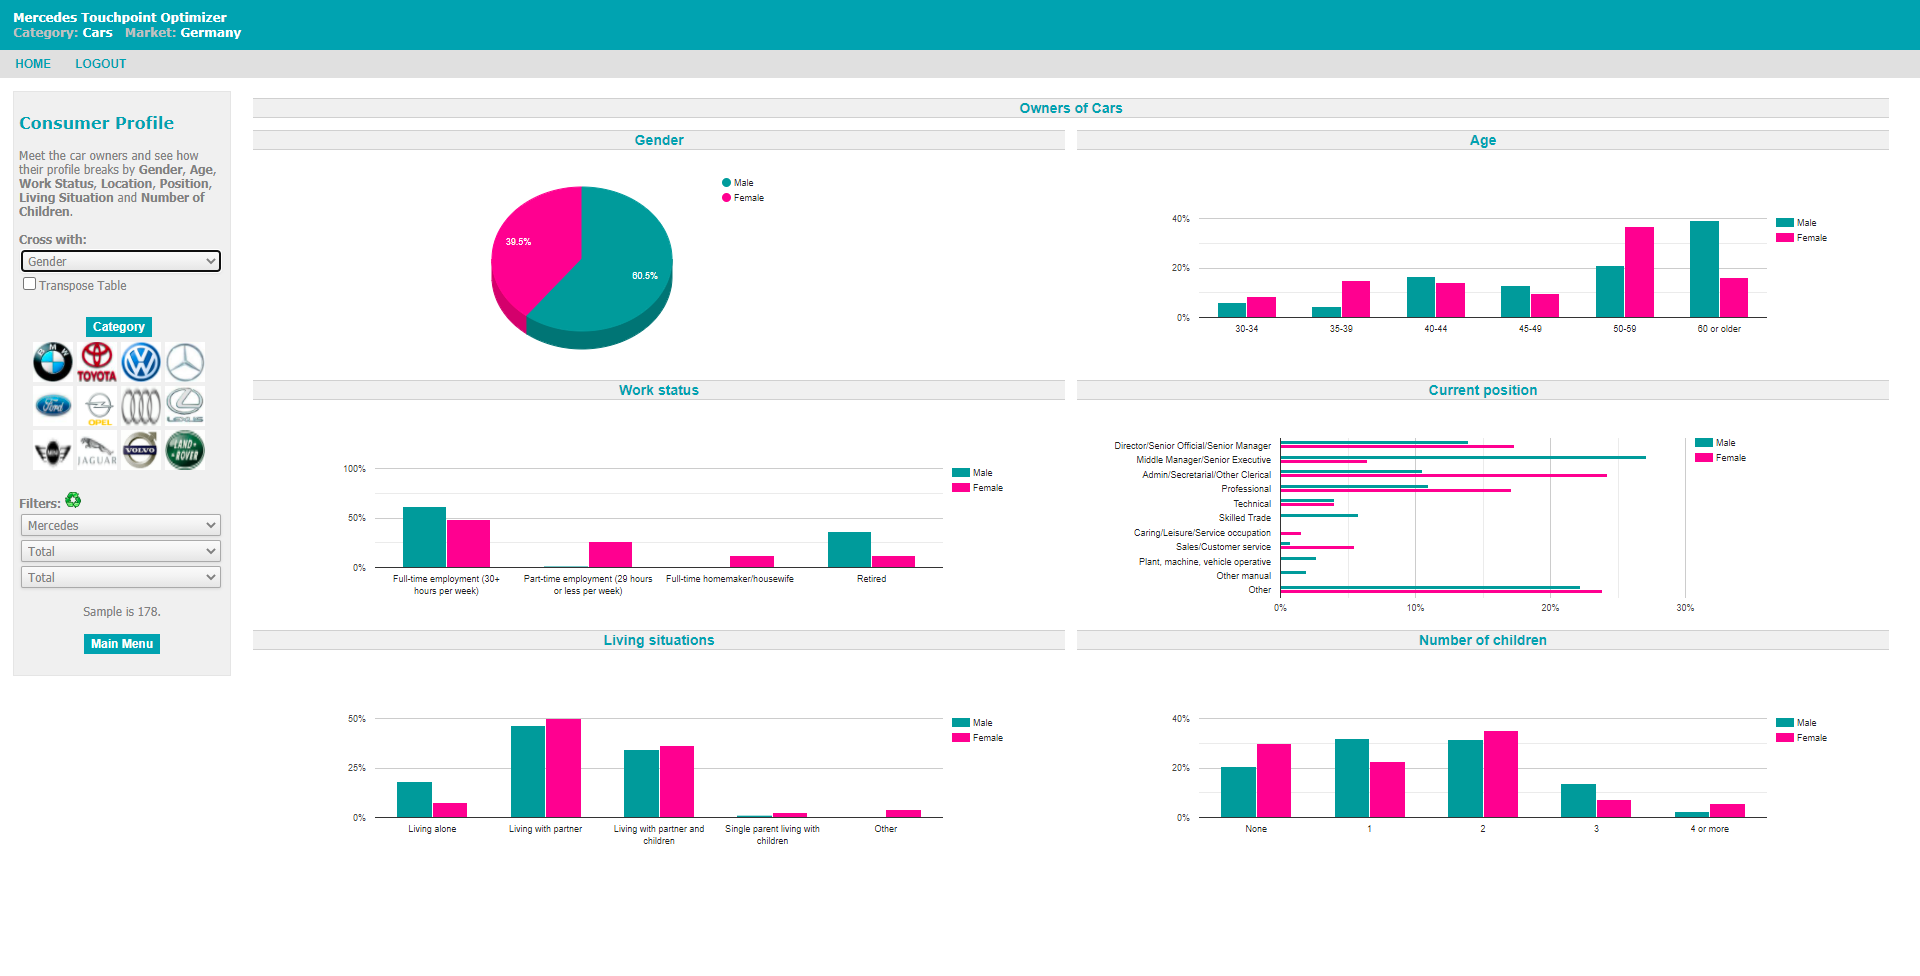
SCREENSHOTS
SCREENSHOTS
Here are some screenshots from various modules. Click on the images to zoom in.